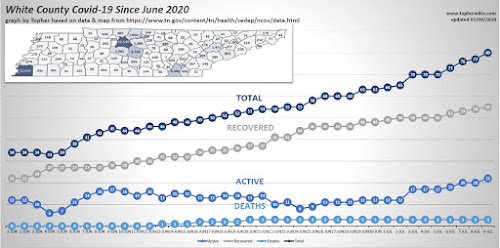
I haven't been able to find charts and graphs of Covid-19 data in White County, so I began creating them on June 1st. Here's the latest as of 09/11. All data is taken from the Tennessee government health site. https://www.tn.gov/content/tn/health/cedep/ncov/data.html
 |
| Since June 1st - Click image for larger view. Updated 9/11 |
 |
| Since June 1st - Click image for larger view. Updated 9/8 |
 |
| Since Aug 1st - Click image for larger view. Updated 9/8 |
 |
| Since Aug 1st - Click image for larger view. Updated 8/27 |
 |
| Since June 1st - Click image for larger view. Updated 8/27 |
 |
| Since June 1st - Click image for larger view. Updated 8/24 |
 |
| Since August 1st - Click image for larger view. Updated 8/24 |


No comments:
Post a Comment
Thanks for your input. May you be blessed today!